Simple linear regression with Python!
Web D.va’s foray into statistical learning begins with creating a simple linear regression calculation function in Python. Ever since I started reading about statistical learning I’ve always wanted to implement a linear regression line in code myself!
Linear Regression
A simple linear regression model can be used to statistically predict basic things. A human can easily model some phenomenom without the computation of data. A machine, on the other hand, has to compute and calculate, using data, statistical models (such as simple linear regression) to be able to provide some value, such as a line on a two-dimensional Cartesian plane that models the relationships between some sets of variables.
Definitions
A simple linear regression line for elementary data points has the form of $\hat{y} = a + bx$.
For a pair of a set of variables $x$ and $y$, the slope $b$ of the regression line can be defined as
\[b = r_{x,y}\Big({\sigma_y \over \sigma_x}\Big)\]where $r_{x,y}$ is the correlation between the set of $x$ and $y$ variables and ${\sigma_x}$ and ${\sigma_y}$ are the standard deviations of the $x$ and $y$ set of variables. The standard deviation for a set of variables $x$ with size $n$ can be determined by calculating the square root of the variance of the set of variables, which can be determined with
\[\sigma_x^2 = {1 \over n}{\sum\limits_{i=1}^n(x_i - \bar{x})^2}\]with $\bar{x}$ being the mean average of the $x$ set of variables. The correlation $r_{x,y}$ can be determined by calculating
\[r_{x,y} = {\sum\limits_{i=1}^n(x_i - \bar{x})(y_i - \bar{y}) \over \sqrt{\sum\limits_{i=1}^n(x_i - \bar{x})^2 \sum\limits_{i=1}^n(y_i - \bar{y})^2}}\]with $\bar{x}$ and $\bar{y}$ being the mean average of the $x$ and $y$ sets of variables.
The $y$-intercept $a$ can be determined by $a = \bar{y} - b\bar{x}$.
By calculating the relationships between variables in a pair of sets, and thus determining relationships between data points, the statistical learning practitioner can create a model for inferring and predicting phenomenom for a machine program.
The implementation
Using the above simple definitions, I wrote a function in Python to return the slope and $y$-intercept of the simple linear regression line for a set of data points.
import math

# x is the set of x-variables and y the set of y-variables
def calculateLinearRegressionLine(x, y):

    # First, calculate the standard deviations of each set of variables.
    x_standardDeviation = math.sqrt(sum((i - sum(x) / len(x))**2 for i in x) / len(x))
    y_standardDeviation = math.sqrt(sum((i - sum(y) / len(y))**2 for i in y) / len(y))

    # Next, calculate the correlation between the x and y variables.
    avg_x = float(sum(x)) / len(x)
    avg_y = float(sum(y)) / len(y)
    diffprod = 0
    xdiff2 = 0
    ydiff2 = 0
    for idx in range(len(x)):
        xdiff = x[idx] - avg_x
        ydiff = y[idx] - avg_y
        diffprod += xdiff * ydiff
        xdiff2 += xdiff * xdiff
        ydiff2 += ydiff * ydiff
    r_xy_correlation = diffprod / math.sqrt(xdiff2 * ydiff2)

    # Using the calculated standard deviations and correleation, calculate the slope of the regression line.
    b = r_xy_correlation * (y_standardDeviation / x_standardDeviation)

    # Calculate the y-intercept of the regression line.
    a = avg_y - b * avg_x

    # Return the result of this algorithm as a tuple of the slope and y-intercept of the regression line.
    return (b, a)
I had trouble writing Python code to calculate the correlation value as I was not experienced with Python’s math facilities, so I had to resort to using an implementation of the correlation definition that was not my own. I was not familiar with how to deal with the float-int conversion type-errors that resulted from me trying to implement calculating the correlations between the variable sets.
Nonetheless, the calculateLinearRegressionLine(x, y) function returns a tuple of the slope and $y$-intercept, respectively, for the linear regression line for a set of points.
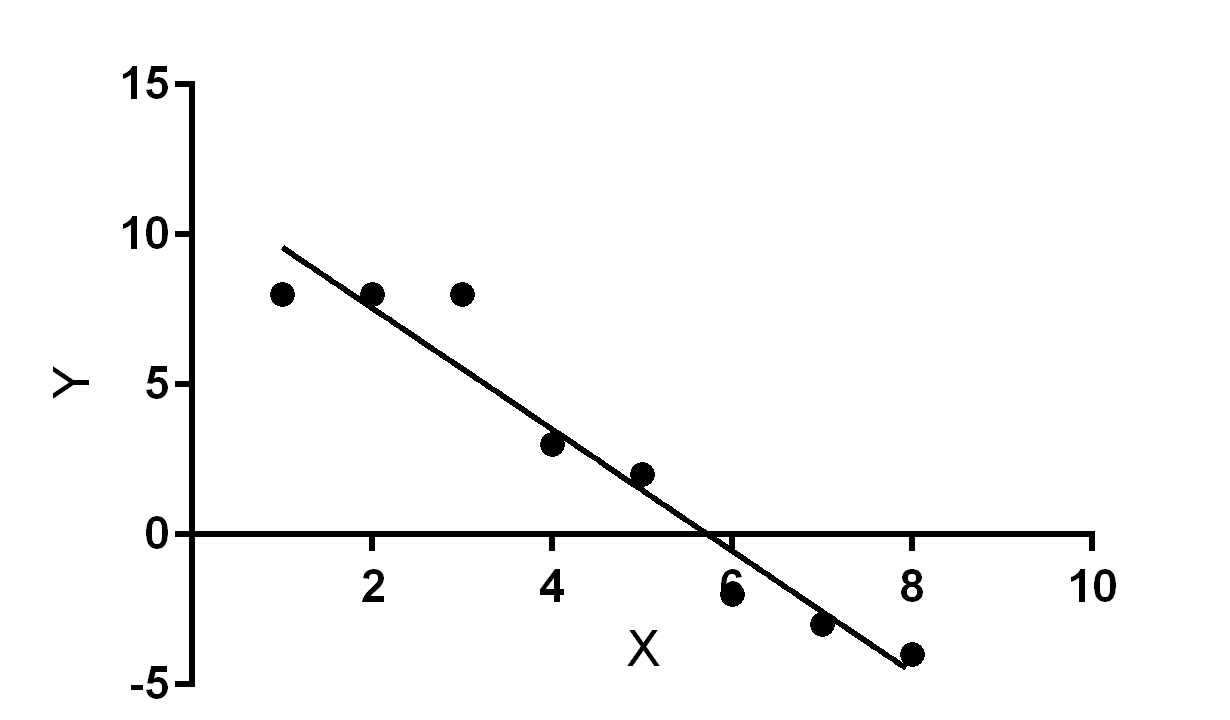
For instance, x = [1, 2, 3, 4, 5, 6, 7, 8] and y = [8, 8, 8, 3, 2, -2, -3, -4] entered as inputs to the function yield the tuple (-2.0737876550156327, 11.832044447570347) as the return value, with -2.0737876550156327 being the slope and 11.832044447570347 being the $y$-intercept of the linear regression line.
Plotted onto a graph, the resulting slope and $y$-intercept pair give a line that best fits the $x$ and $y$ data points. The new line represents the probabilities of the locations of data points with data points having the highest probability of being on or near the line.
Afterward
I chose to invest in myself by engaging in this exercise in implementing a statistical learning concept in software, the equivalent of writing your own rendering loop for a game instead of using a game framework or writing vanilla Javascript instead of using Vue.js. When I start doing machine learning projects, though, I won’t be implementing my own statistical functions, of course. I would be using something like Python’s numpy or any other statistics framework’s functions which have already implemented things like linear regression.
What’s going to happen next?
That ultimately depends on what strategic moves I choose to make with the goal of satisfying my career objectives.
I have ideas for machine learning projects that I want to start, such as text classification and prediction. Equipped with the strength of having accomplished the completion of this linear regression exercise, I understand that I can further develop my capabilities to do machine learning.